Articles / Unlocking Growth: The Case for Interprovincial Trade Liberalization in Atlantic Canada
Introduction
Interprovincial trade is a vital part of Canada’s economy, accounting for $532 billion in goods and services traded across provincial borders in 2023 (about 18% of GDP)(1) Atlantic Canada in particular relies heavily on interprovincial commerce – for example, in Nova Scotia and Prince Edward Island, internal trade made up over half of all their trade (domestic + international) in 2023 (2). Key Atlantic industries are deeply intertwined with other provinces: Statistics Canada data show wholesale trade and manufacturing firms are the most engaged in interprovincial trade (over 50% of such businesses sell to other provinces)(3).
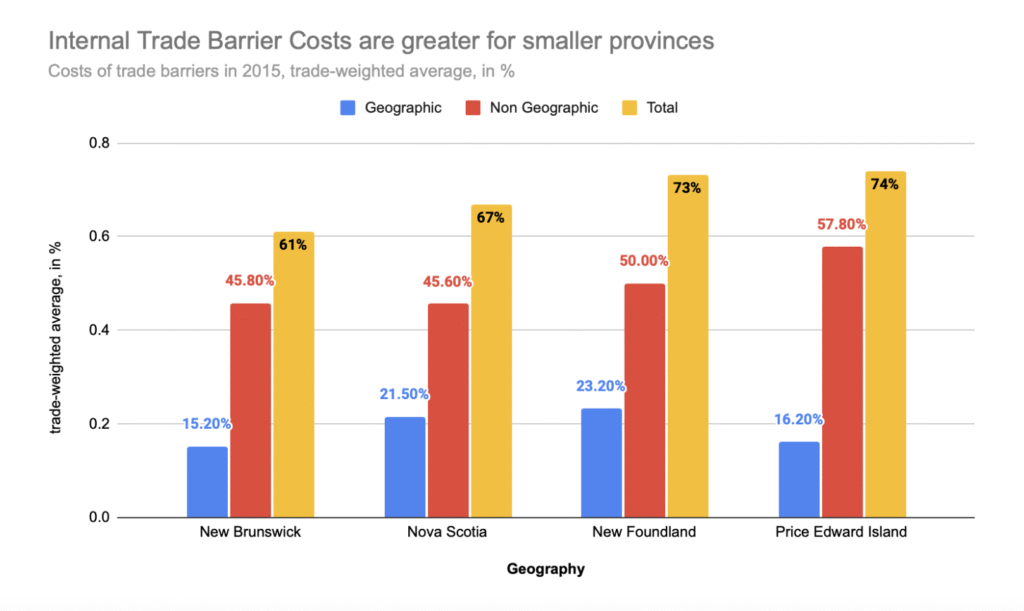
Atlantic Canada’s smaller provinces face the highest internal trade costs, meaning they stand to gain the most from liberalization. In 2015, total internal trade barrier costs reached 74% in Prince Edward Island, 73% in Newfoundland & Labrador, 67% in Nova Scotia, and 61% in New Brunswick. A significant portion of these costs came from non-geographic (regulatory) barriers, accounting for 57.8% in PEI, 50% in Newfoundland, 45.6% in Nova Scotia, and 45.8%in New Brunswick, while geographic barriers made up 16.2%, 23.2%, 21.5%, and 15.2% respectively. Given these high percentages, the IMF and Statistics Canada estimate that eliminating these barriers could raise real GDP per capita by up to 16% in PEI, 12.8% in Newfoundland & Labrador, and 4.8–6% in Nova Scotia and New Brunswick, with employment gains as high as 11–13% in PEI and Newfoundland and 1–3% in Nova Scotia and New Brunswick(4).
1 – Statistics Canada. (2025, March 19). Interprovincial trade flows and frictions: Approximately $532 billion worth of goods and services traded across provincial and territorial borders in 2023 (The Daily).
https://www150.statcan.gc.ca/n1/daily-quotidien/250214/dq250214d‑eng.htm
2 – Statistics Canada. (2025, March 19). Interprovincial trade flows and frictions: Approximately $532 billion worth of goods and services traded across provincial and territorial borders in 2023 (The Daily).
https://www150.statcan.gc.ca/n1/daily-quotidien/250214/dq250214d‑eng.htm
3 – Statistics Canada. (2025, February 14). Canadian Survey on Interprovincial Trade, 2023.
https://www150.statcan.gc.ca/n1/daily-quotidien/250214/dq250214d‑eng.htm
4 – Royal Bank of Canada. (n.d.). Six questions about the significance of interprovincial trade barriers in Canada. RBC Thought Leadership.
https://www.rbc.com/en/thought-leadership/economics/featured-insights/six-questions-about-the-significance-of-interprovincial-trade-barriers-in-canada/#:~:text=The%20IMF%20estimates%20that%20smaller,in%20productivity%20and%20economic%20growth
Chart 1: Internal Trade Barrier Costs in smaller provinces.
Sectoral Impacts: Who Wins and Who Loses
Different sectors will experience the effects of interprovincial trade liberalization in distinct ways. Below we highlight some key sectors for Atlantic Canada and rural markets, and how each might fare:
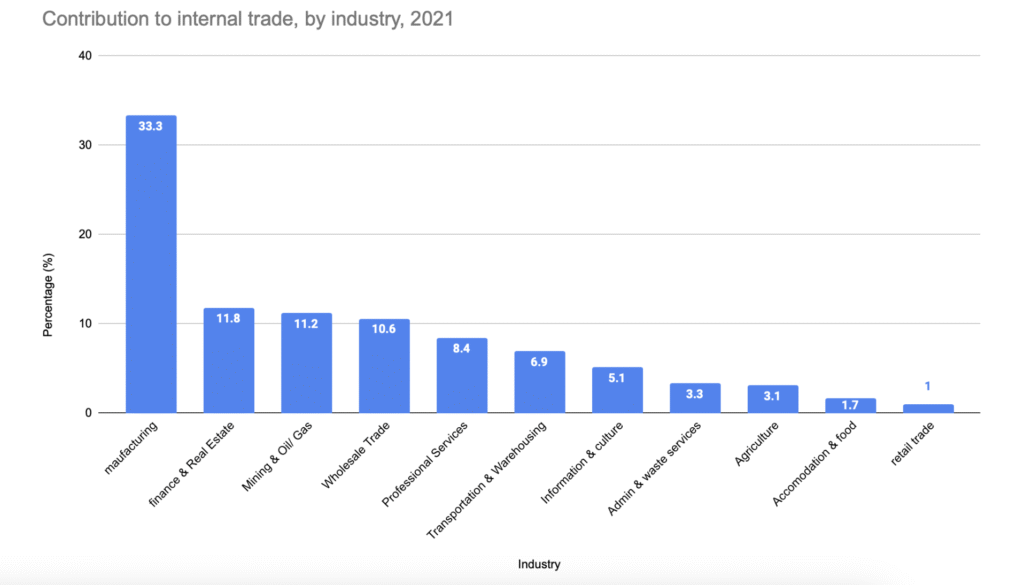
Winners: Efficient manufacturers in Atlantic Canada gain a wider market and can scale up. For example, a New Brunswick food processing company could dramatically expand sales across Canada once burdensome provincial rules (like duplicate food inspections or label requirements) are reconciled. Overall manufacturing output traded interprovincially is already huge (one-third of internal trade by value)(5).
5 – Statistics Canada. (2025, March 19). The Daily — Manufacturing accounts for one‑quarter of internal trade.
https://www150.statcan.gc.ca/n1/daily-quotidien/250319/dq250319c-eng.htm#:~:text=Manufacturing%20accounts%20for%20one,internal%20trade
Chart 2: Contribution to Internal Trade by Industry 2021
Losers: Less competitive factories or workshops might struggle. If an Atlantic manufacturer’s costs are, say, 10% higher than a Quebec rival’s, previously it might have been shielded in its home province; post-liberalization, it could lose local market share. Sectors such as pulp and paper or small-scale fabricated metals in Atlantic Canada might see tougher competition from central Canadian firms (though Deloitte’s analysis suggests even those sectors would eventually adjust and still realize net growth)(6). Rural manufacturing plants in single-factory towns are particularly vulnerable if they cannot modernize or if production shifts to larger facilities elsewhere.
Under the supply management system, provincial quotas and marketing protections shield local producers in Atlantic Canada. Opening trade could expose them to competition from larger producers in other provinces.
Opening Borders, Closing Gaps: Who Stands to Lose in Atlantic Canada as Trade Barriers Fall?
Atlantic Canada’s business community has long faced challenges in scaling across provincial borders. With renewed efforts by federal and provincial governments to reduce interprovincial trade barriers, the region is poised to benefit from a more integrated national economy. However, new opportunities also bring competitive pressures. Some businesses stand to gain, while others may struggle to adapt.
This piece draws on the latest Statistics Canada data to explore who may be left behind if trade restrictions continue to fall.
Interprovincial Trade Participation: Atlantic vs. National
Data from Statistics Canada (7) in chart 3 reveals that while many Atlantic businesses are actively purchasing from other provinces, fewer are selling outside their borders:
6 – Deloitte Canada. (n.d.). The case for free interprovincial trade: One Canadian economy. Deloitte Canada. https://www.deloitte.com/ca/en/Industries/government‑public/perspectives/the‑case‑for‑free‑interprovincial‑trade.html
7 – Statistics Canada. (2025, February 14). Businesses’ interprovincial trade activities conducted within Canada over the last 12 months
Chart 3: Businesses’ interprovincial trade activities conducted within Canada over the last 12 months
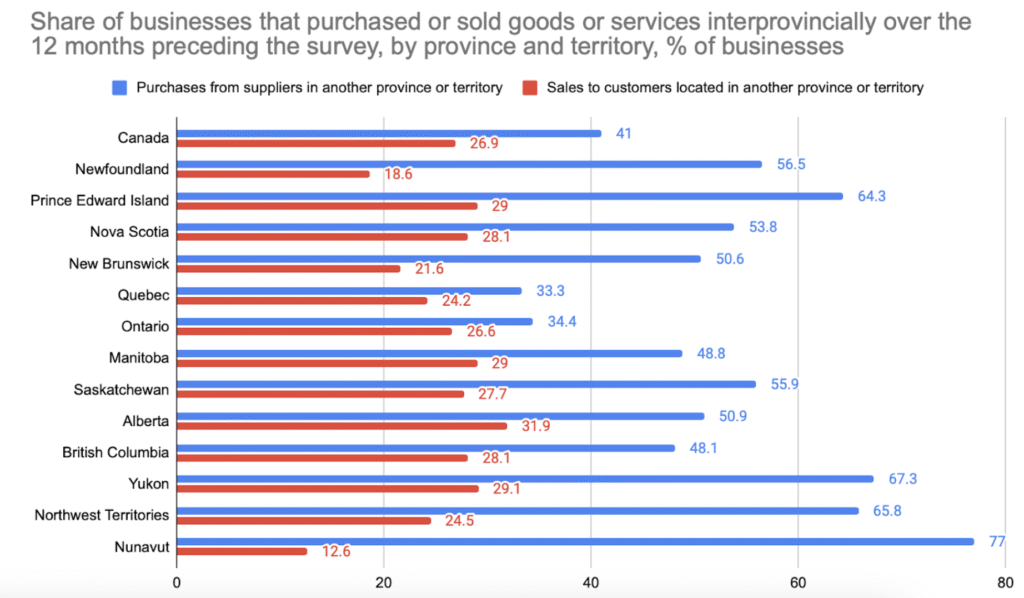
These rates are below the national average for selling (26.9%), suggesting that many Atlantic businesses operate within provincial boundaries and may not yet be ready for increased interprovincial competition.
Trade-to-Output Ratios: Sector Vulnerabilities
These lower selling rates compared to the national average point to a deeper structural issue: many Atlantic firms are inward‑focused, relying heavily on local demand. This pattern is echoed in trade-to-output ratios, which measure how much of a sector’s production crosses provincial borders. Sectors with low interprovincial trade as a share of output tend to be more insulated—and thus more exposed when barriers fall.
Chart 4: Contribution to internal trade, by industry, 2021.
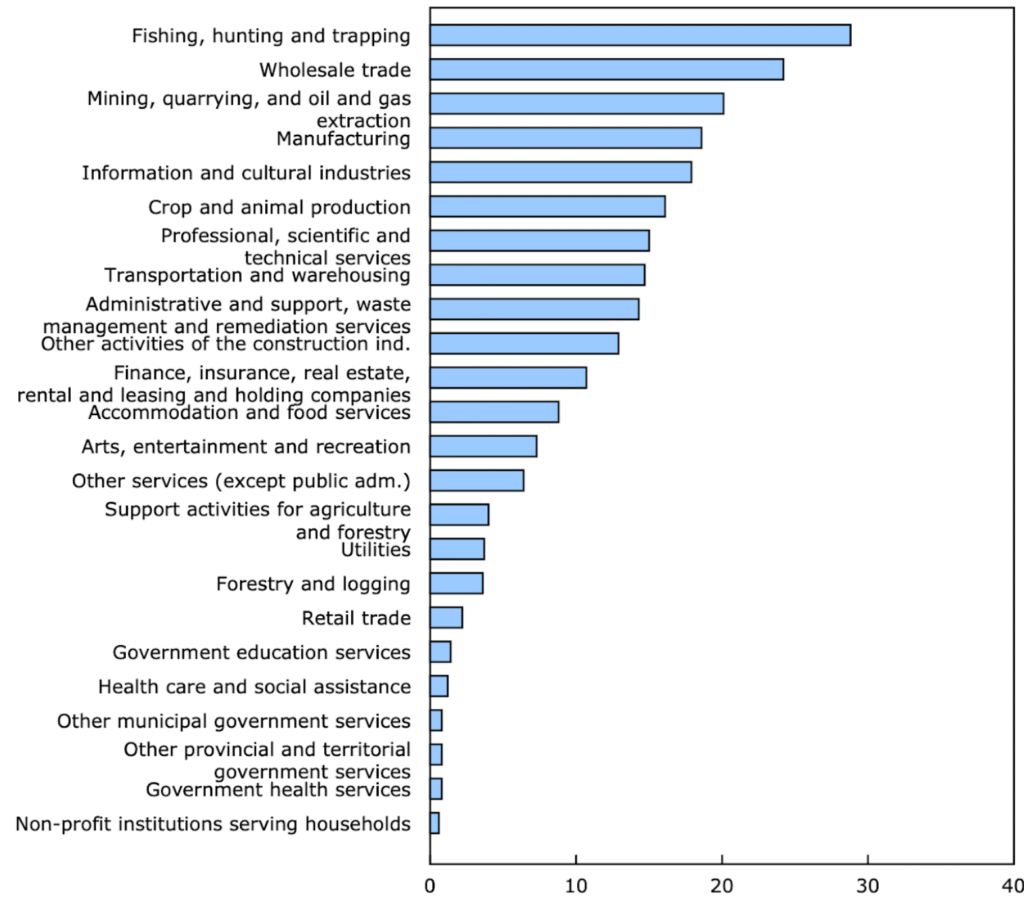
Source: Statistics Canada : Interprovincial trade flows and fractions: https://www150.statcan.gc.ca/n1/en/daily-quotidien/250319/dq250319c-eng.pdf?st=vGxCPA5N
- Fishing, hunting, and trapping: 28.8% of output traded interprovincially
- Wholesale trade: 24.2%
- Manufacturing: 18.6%
- Construction: 11.2%
- Retail trade: 7.6%
- Accommodation and food services: 3.5%
- Professional, scientific, and technical services: 5.9%
- These ratios reveal how reliant sectors are on other provincial markets. High trade-to-output ratios suggest readiness to benefit from trade liberalization. Low ratios suggest vulnerability—these sectors may not currently compete outside provincial borders and could be disrupted by external competition once barriers are removed.
At-Risk Sectors: Who Are the Potential “Losers”?
- Small-Scale Agri-Food and Processors: These businesses often serve local markets, lack the scale for broader distribution, and face steep competition from centralized producers. The removal of trade barriers may expose them to lower-cost goods from Ontario and Quebec.
- Professionally Regulated Services: Legal, health, skilled trades, and accounting services are often subject to provincial regulation. Harmonizing standards could benefit consumers but challenge locally focused firms unable to compete across jurisdictions.
- Liquor Boards and Local Distributors: Provincial liquor control boards and small beverage distributors may see margins eroded as national brands gain direct access to new markets. Nova Scotia and New Brunswick’s state-monopoly models are especially exposed.
- Legacy Retail and Local Transportation: Retailers with localized supply chains and regional logistics providers could be outcompeted by firms with national distribution scale.
Atlantic Canada Stands to Gain the Most from Cutting Trade Barriers
Table 1 shows that cutting trade barriers inside Canada would hugely benefit Atlantic provinces, especially compared to the rest of the country. Even small cost reductions could raise incomes by a few hundred dollars per person, while full mutual recognition of standards could boost GDP per person by thousands—over $12,000 in PEI and nearly $6,000 in Nova Scotia.
The table shows that reducing trade barriers within Canada would have a much larger economic impact on Atlantic provinces than on the rest of the country. Even a small drop in costs, like a uniform 1% reduction, could increase labour productivity by 0.11%–0.30% across the region and raise real GDP per person by $59 in New Brunswick, $88 in Nova Scotia, $169 in Prince Edward Island, and $79 in Newfoundland and Labrador, compared to only $5 for Canada as a whole. With a slightly larger 2.3% cost reduction, these gains roughly double. The biggest impact comes from full mutual recognition of standards between provinces, which would allow goods and services to move more freely. Under this scenario, PEI’s labour productivity would jump by 22.42% and GDP per person would rise by over $12,500, while Nova Scotia would see an 11.22% productivity gain and nearly $6,000 more per person. These figures highlight that Atlantic Canada, with its small, trade-dependent economies, would benefit far more than the national average from internal trade liberalization.
Table 1: Economic Gains from Atlantic Canada Trade Liberalization
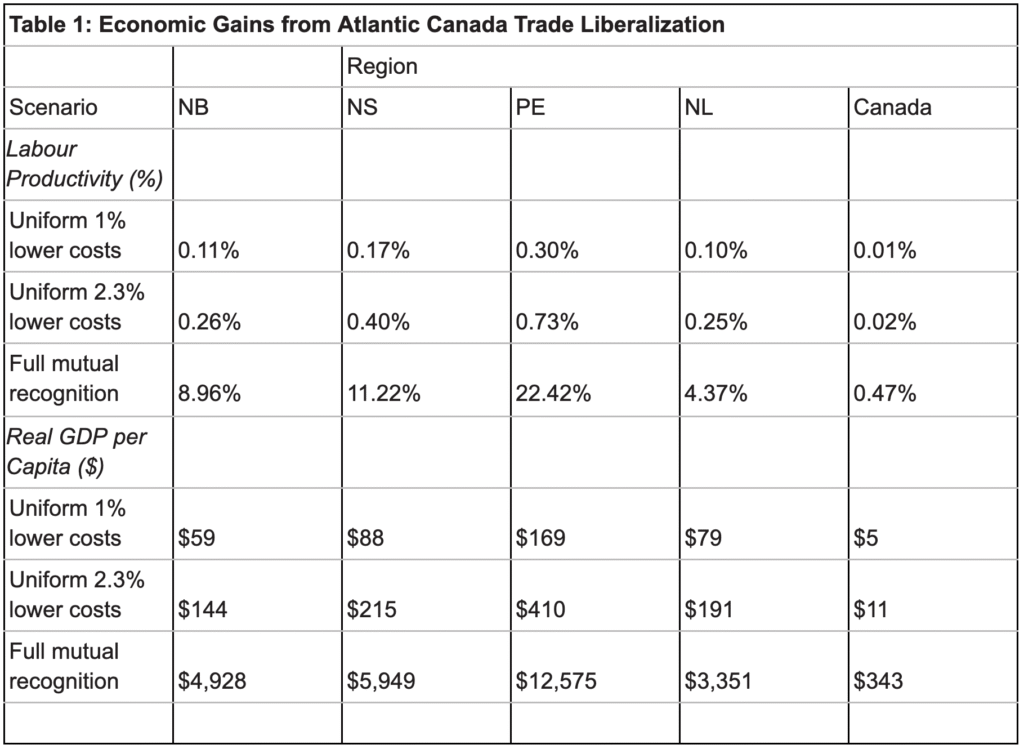
Author’s Calculations*Trevor Tombe, PPF Fellow, Director of Fiscal and Economic Policy at the University of Calgary’s School of Public Policy
Source:Public Policy Forum, Free Atlantic: Unlocking Regional Growth
Who Could Lose Out When Trade Barriers Fall in Rural Canada?
A small share of rural establishments are engaged in interprovincial or international goods trade significantly lower than urban centers.
As per Chart 3, In primary industries like agriculture, forestry, fishing, the establishment counts and trade values are concentrated in a few exporters, leaving most small businesses with limited access to broader markets.
Chart 4: Number of Exporting and Importing establishments by top 5 industries in Non-Census metropolitan areas 2023.
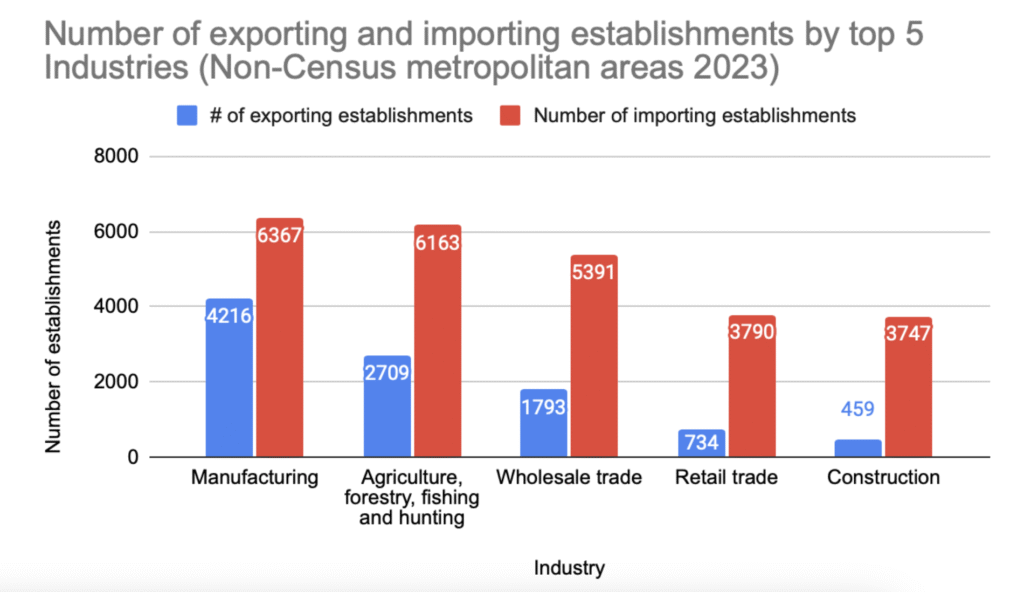
Graph 3 highlights a significant imbalance between exporters and importers in rural economies nationwide. In 2023, manufacturing led rural exports with 4,216 establishments, followed by agriculture, forestry, fishing, and hunting with 2,709. However, in every major rural industry, importing establishments far outnumber exporters—manufacturing saw 6,367 importers, agriculture 6,163, wholesale trade 5,391, retail trade 3,790, and construction 3,747. This gap suggests that many rural businesses are net consumers of goods from other regions rather than active participants in interprovincial trade. When national trade barriers are removed, this structural imbalance creates short-term vulnerabilities. Sectors such as small-scale agriculture, food processing, rural retail, wholesale distributors, and local construction trades are especially at risk; they serve primarily local markets and lack the scale or integration to compete with larger firms from other provinces.
Opportunities to Facilitate Interprovincial Trade in Atlantic Canada (8)
Interviews with Atlantic Canadian firms show that while most are already trading goods or services across provincial borders, about 70% identified barriers to interprovincial trade. Another 14% said the main challenge isn’t provincial rules but the high costs of meeting Canadian Food Inspection Agency (CFIA) standards to move food products between provinces. Several food producers noted that obtaining CFIA approval for interprovincial shipments can be expensive enough to deter expansion, especially for small processors.
Transportation was another major concern. Firms repeatedly pointed to truck weight and dimension differences between provinces, with New Brunswick’s stricter quad axle weight limits compared to Quebec highlighted as a costly barrier. Even after decades of harmonization efforts, trucking and logistics companies still face inefficiencies from varying provincial regulations, multiple permits for oversize loads, and inconsistent registration rules. Businesses also identified the Marine Atlantic ferry service as a pinch point for perishable goods, where delays and cancellations create both cost and spoilage risk.
Alcohol and food producers reported that provincial liquor monopolies and food inspection regimes act as structural barriers. Newfoundland and Labrador’s rule allowing only locally brewed beer in convenience stores was cited as effectively blocking interprovincial access to 85% of that province’s beer market. Some restaurateurs said it was “easier to get wine and beer internationally than from other Atlantic provinces.” Small food processors explained that moving from a provincially inspected facility to a federally approved one to meet CFIA standards for interprovincial sales could require capital upgrades worth half their annual revenues—an impossible leap for many SMEs.
Trucking and food processing aren’t the only industries affected. Electricity transmission “pancaking” (extra tariffs as power crosses multiple provincial grids) was cited as raising costs for energy exports, while varying fuel tax rates, spring weight restrictions, and differing vehicle registration rules all add compliance costs that hurt cross-border operations.
8 – Atlantic Provinces Economic Council. (2016, October). Trade barriers in Atlantic Canada: Opportunities for regulatory reform.
- admin


Let’s Drive Growth Together
Reach out to us for a free consultation with ASBB Consulting!